桑基图是描述一组数据到另一组数据的流向图,可以观察数据流向的比例关系。 冲击图是一种特殊类型的流图。
ggsankey
ggsankey是基于ggplot2开发的一个包,用于可视化桑基图和冲击图。
1 | # install.packages("devtools") |
ggsankey 构图元素
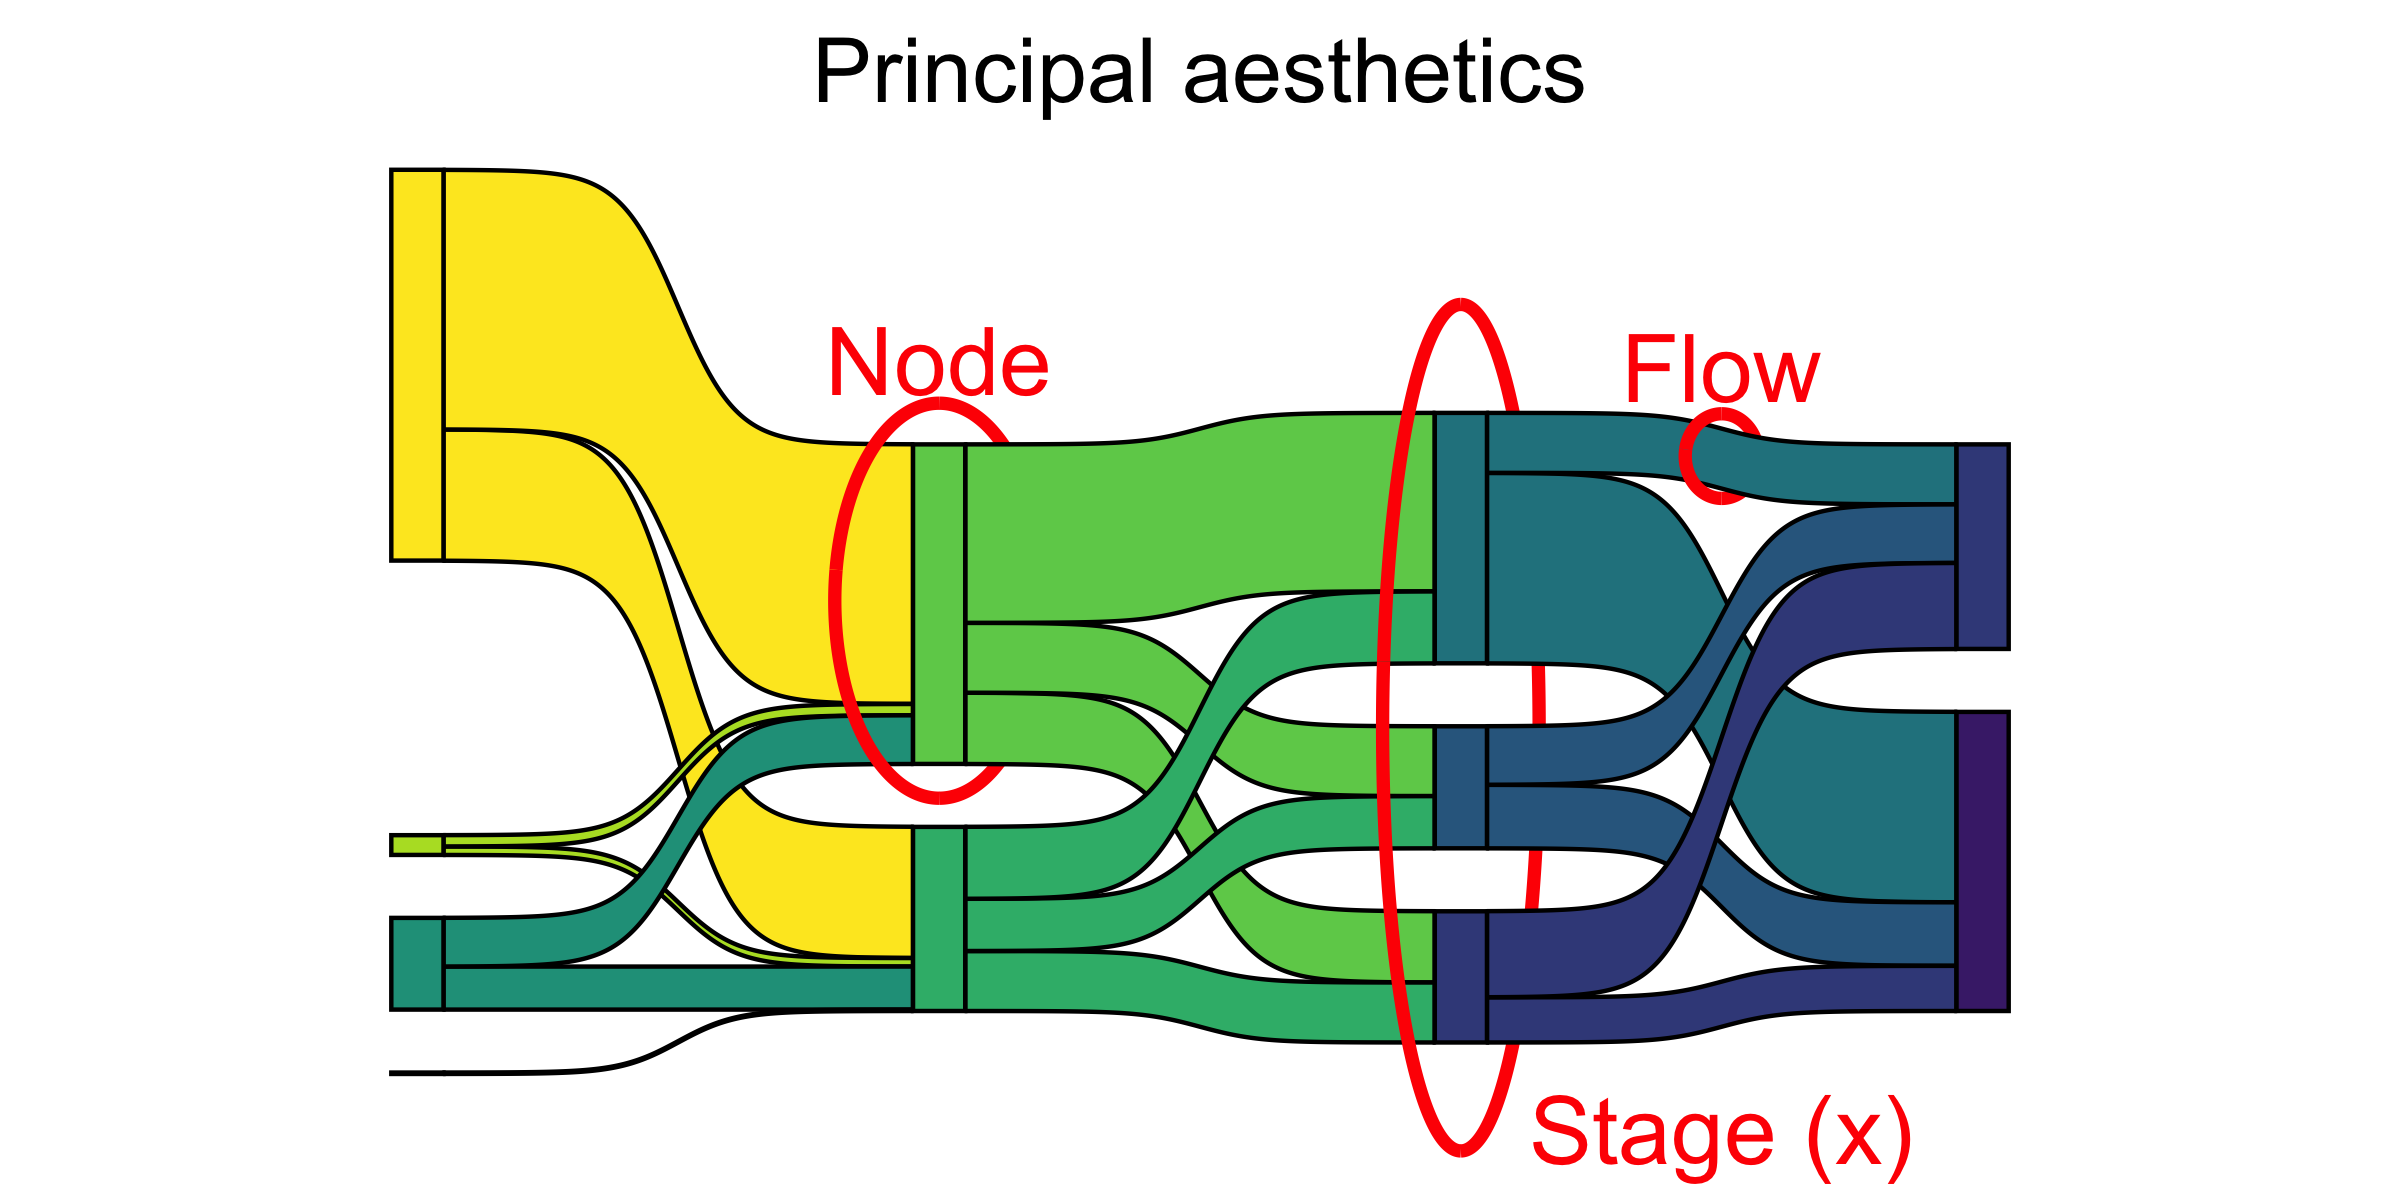 - 每一列表示一个stage, 每个stage有若干个node组成 - 相邻两个stage之间的node存在flow流的关系
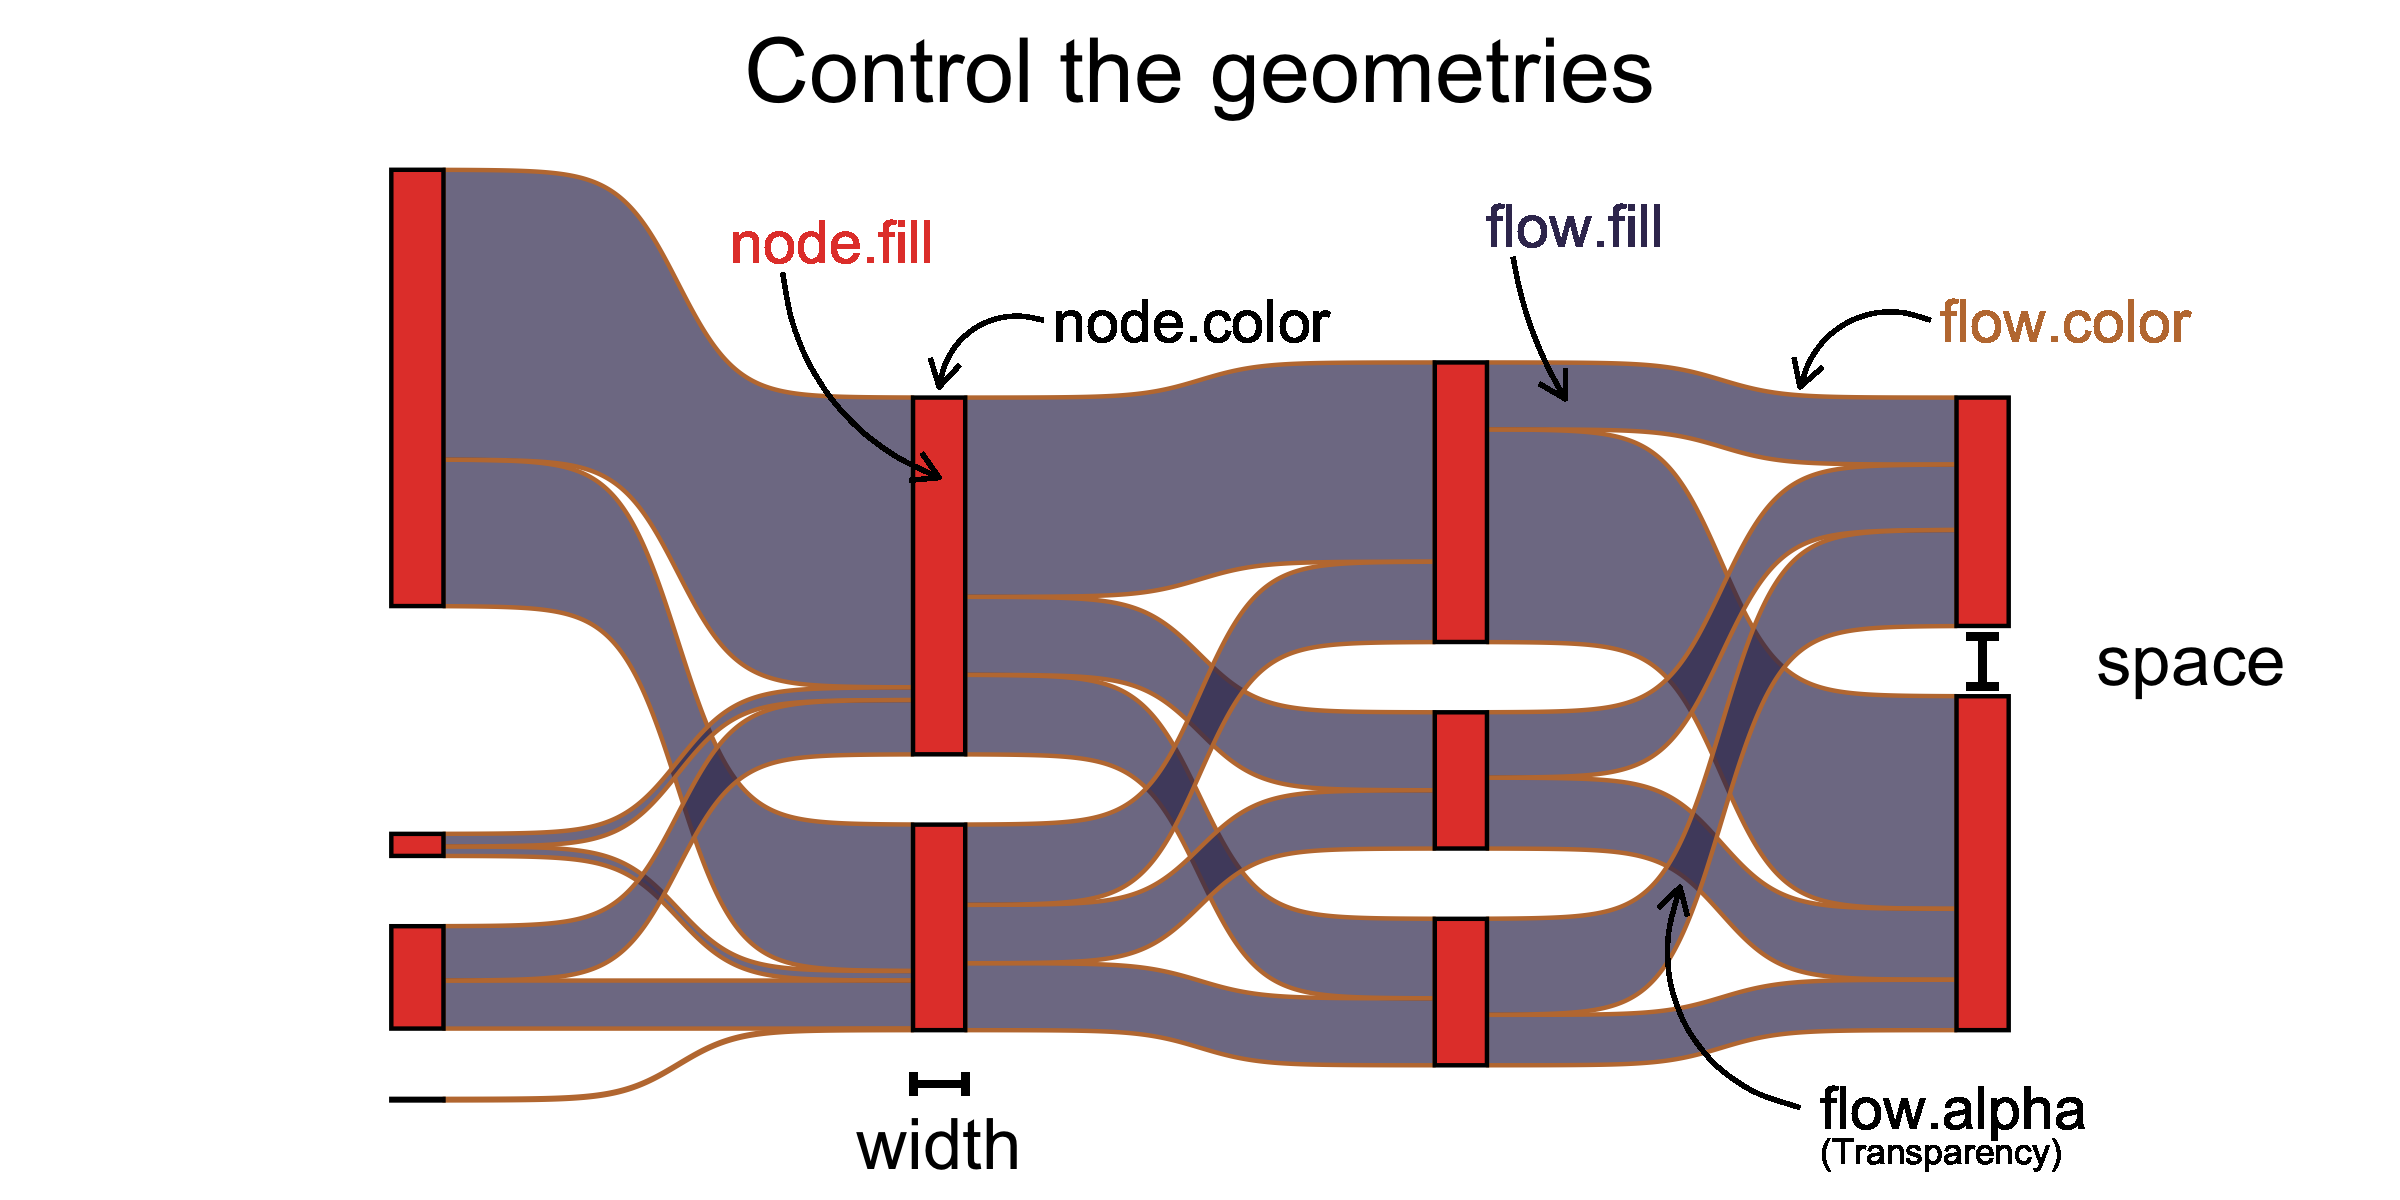
图形参数
- fill设置填充色,分为node.fii和flow.fill
- color设置边框颜色,可分为node.color和flow.color
- width设置node宽度
- flow.alpha设置flow的透明度
- space设置组内node的间距
测试数据
1 | library(ggsankey) |
- 标注node名称
主题设置
1
2
3
4
5
6
7
8
9
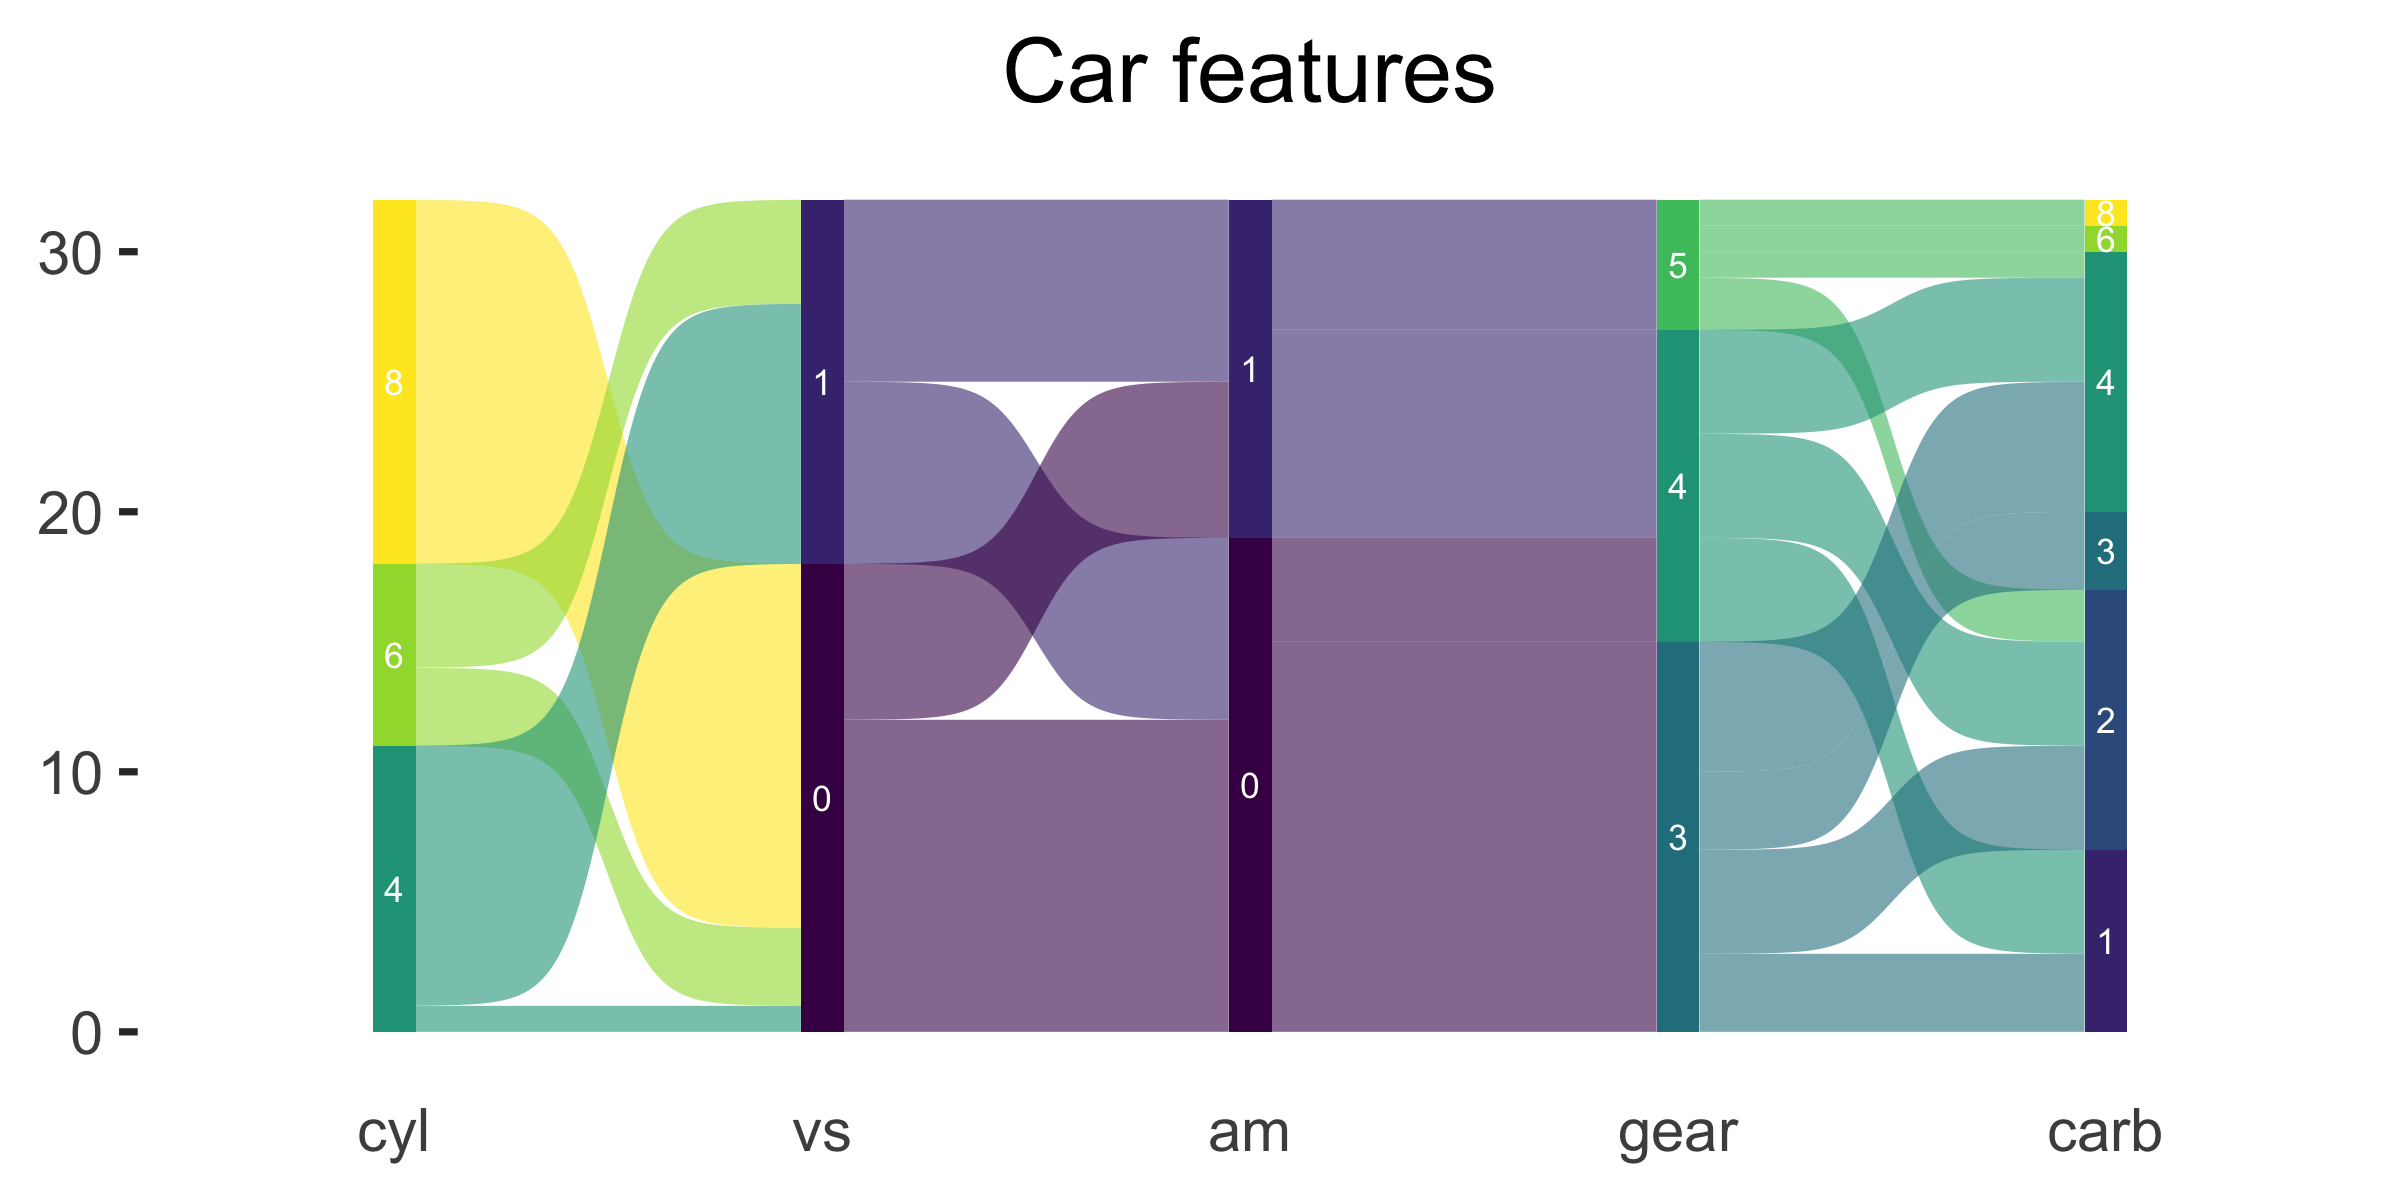
10ggplot(df, aes(x = x, next_x = next_x, node = node, next_node = next_node, fill = factor(node), label = node)) +
geom_sankey(flow.alpha = .6,
node.color = "gray30") +
geom_sankey_label(size = 3, color = "white", fill = "gray40") +
scale_fill_viridis_d() +
theme_sankey(base_size = 18) +
labs(x = NULL) +
theme(legend.position = "none",
plot.title = element_text(hjust = .5)) +
ggtitle("Car features")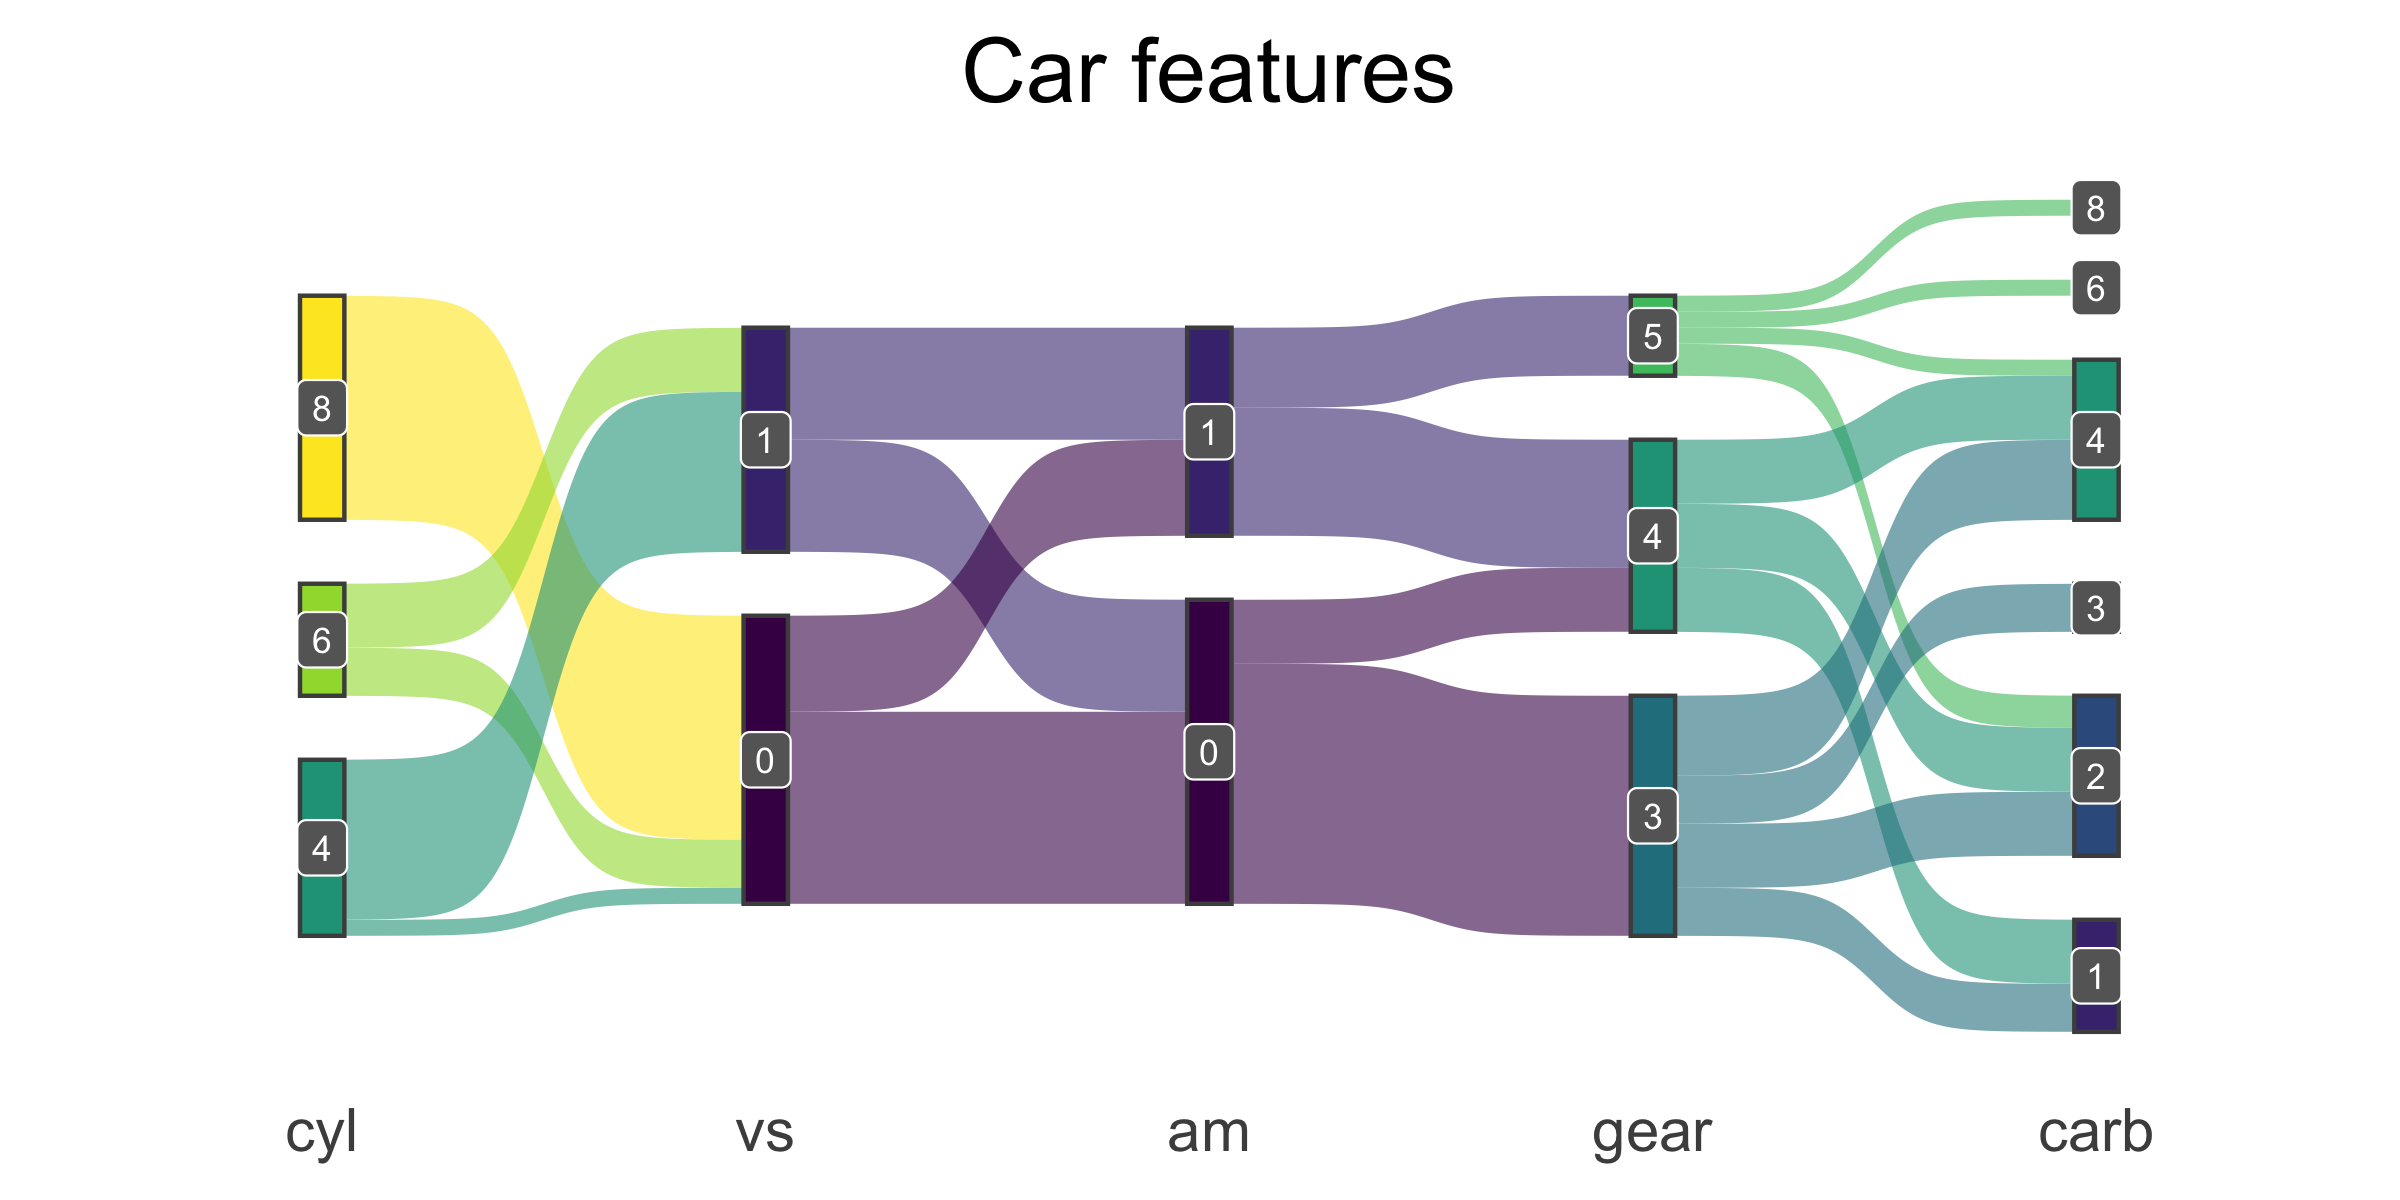
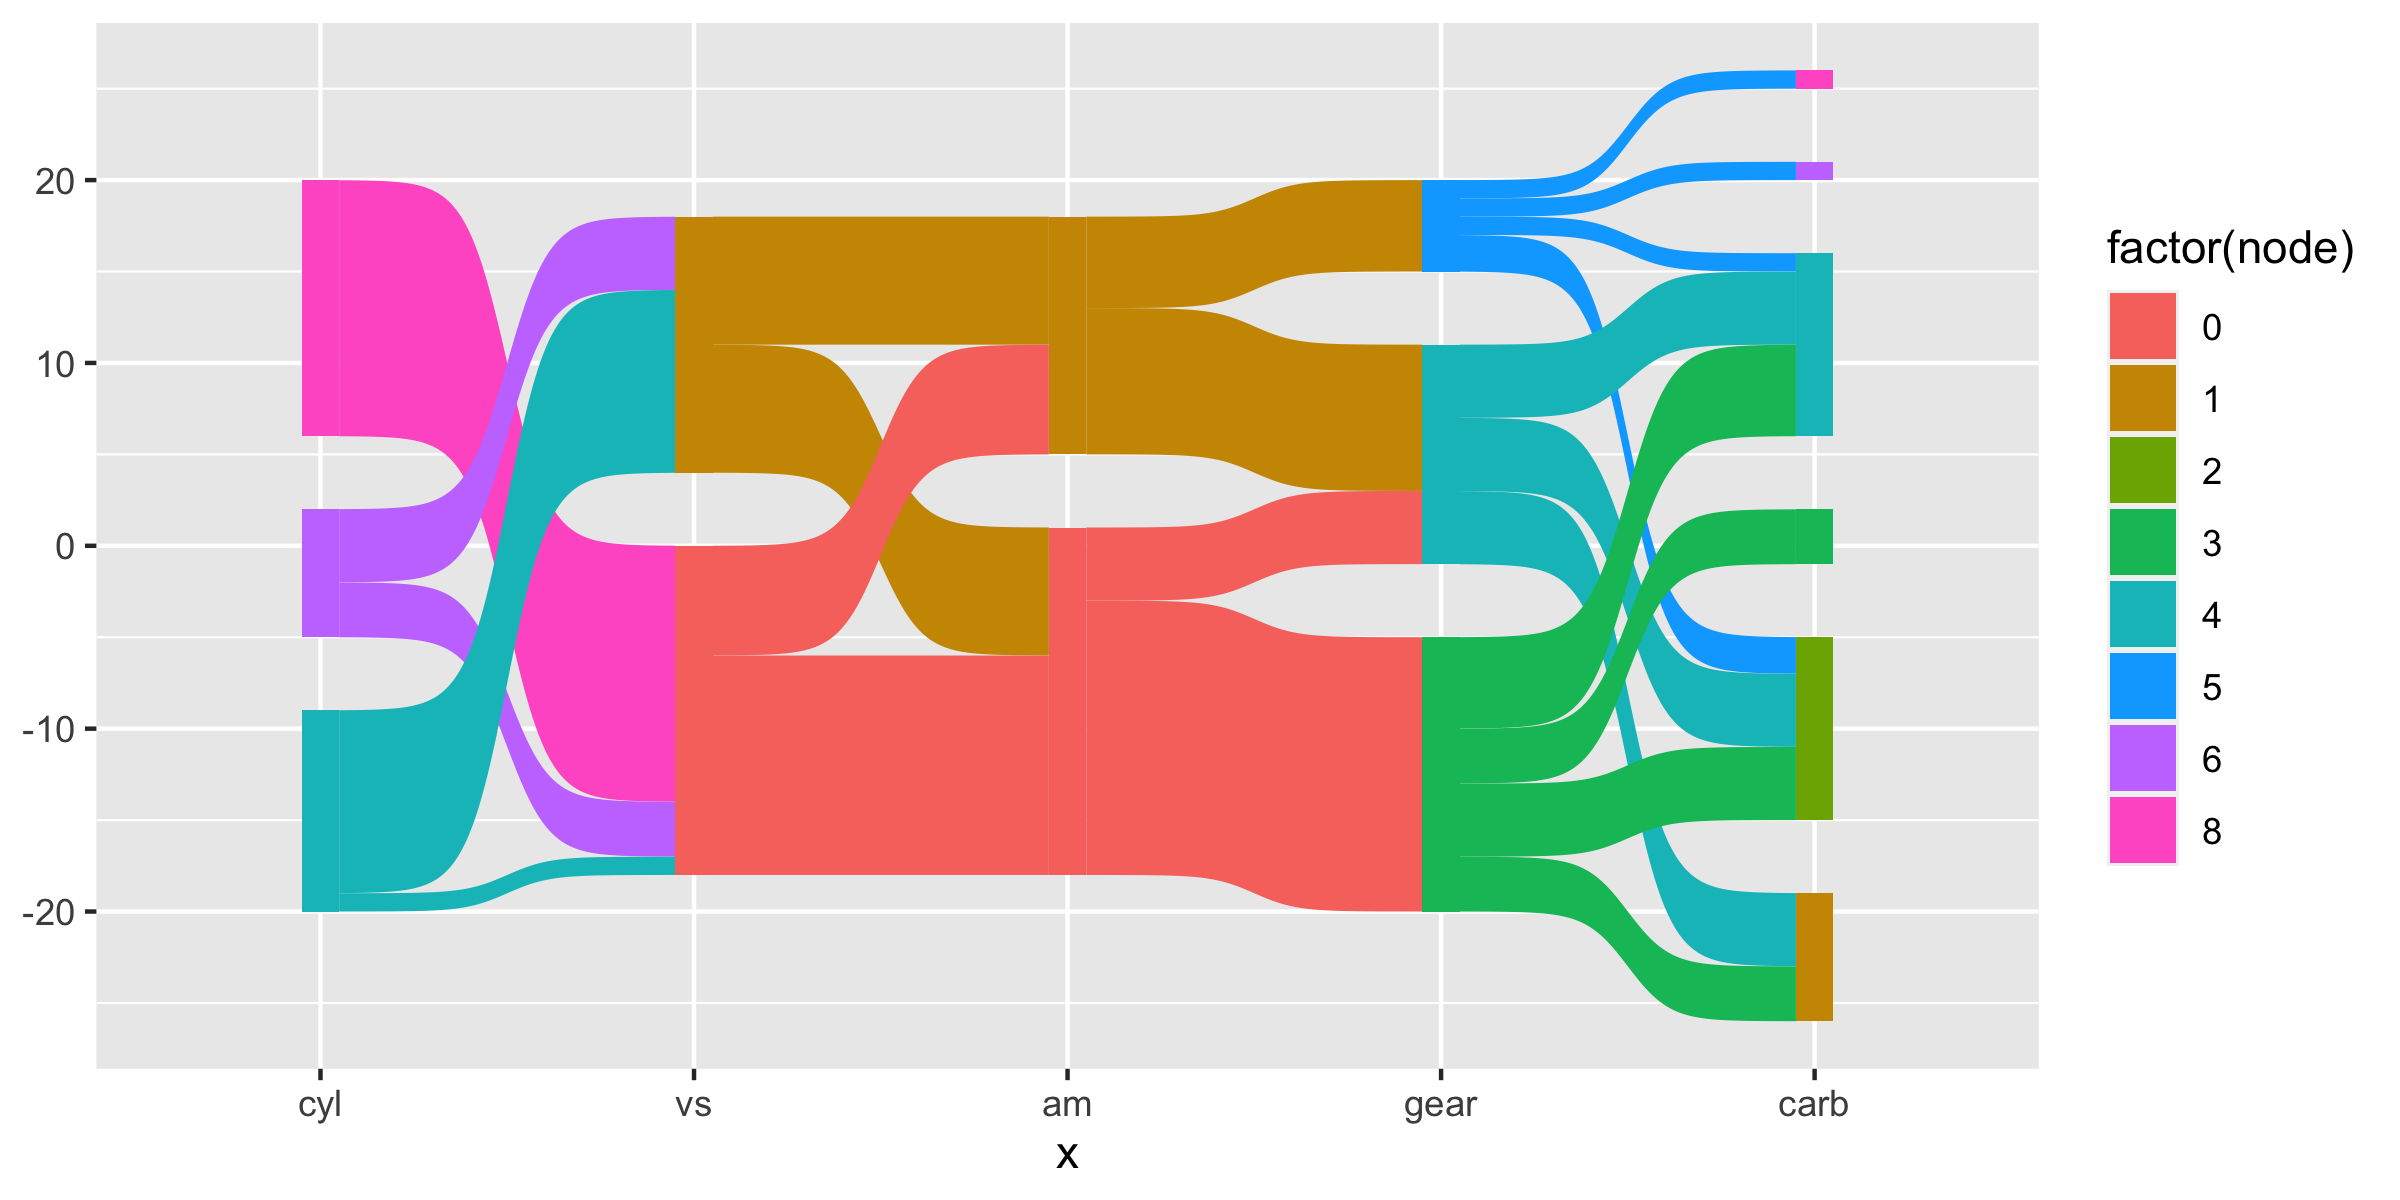
geom_alluvial冲击图 冲积图与桑基图非常相似,但节点之间没有空间,并且以y = 0开始,而不是以x轴为中心。
1 | ggplot(df, aes(x = x, next_x = next_x, node = node, next_node = next_node, fill = factor(node), label = node)) + |